
Where margin hides in a lower mid-market business, and how you find it
An accountant reads a P&L to record what happened. An operator reads the same page to find what should happen next. The document is identical. The job is not.
That difference matters more than it used to. In private equity, margin improvement now accounts for 51 percent of EBITDA growth among European portfolio companies exited in 2025, up from about 21 percent for deals exited before 2023. Top-line expansion used to do most of the work. Now the operating line does. Which puts a premium on people who can look at a set of financials and see where the profit is actually sitting.
In most lower mid-market businesses, the margin you are hunting for is already in the P&L. It is just filed under the wrong heading.
The line item answers the wrong question
A P&L groups money by what it is. Cost of goods. SG&A. Payroll. Those are accounting categories, and they are fine for reporting. They are close to useless for deciding anything, because no one runs a business by category. They run it by activity.
So the first move is to stop trusting the labels. Take the same expense base and reorganize it around what the spending actually does. What did it cost to serve the customers you already have. What did it cost to win new ones. What keeps the lights on. And the revealing one, what belongs to nobody in particular and has been quietly growing for three years because no one owns it.
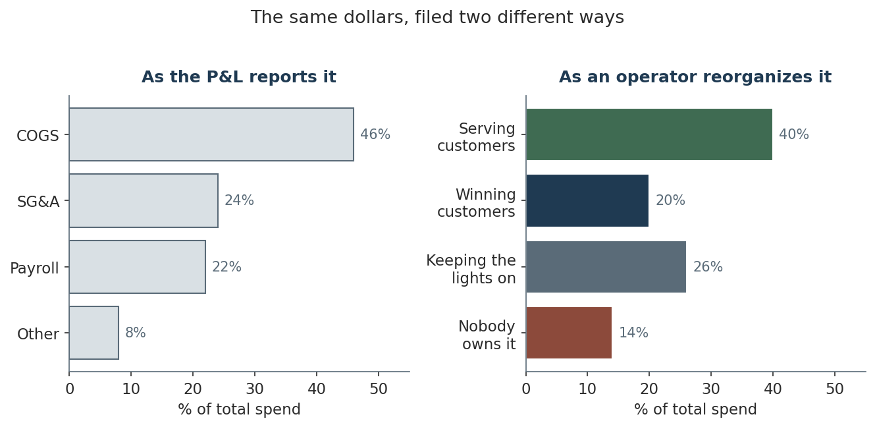
Figure 1. The same dollars, filed two ways. The reorganized view is where the first real question usually shows up.
The reorganized view almost always surprises the owner. The category that felt small turns out to be the one with no owner and no ceiling. That is where you start.
Gross margin is a pricing story wearing a cost costume
When margin is thin, the instinct is to cut. Trim suppliers, squeeze headcount, renegotiate the lease. Sometimes that is right. Often it treats a revenue problem as a cost problem and leaves the real money untouched.
Gross margin is where pricing discipline and delivery efficiency meet. Most businesses default to cost-plus pricing because it feels safe and the math is simple. It also caps your price at a number disconnected from what the customer actually gets. Move a commoditized unit from cost-plus to value-based pricing and the margin can lift without touching the cost base at all. The scale of the lever is easy to underrate. McKinsey’s often-cited figure puts a 1 percent improvement in price at roughly an 8 percent gain in operating profit, more than you get from an equivalent bump in volume.
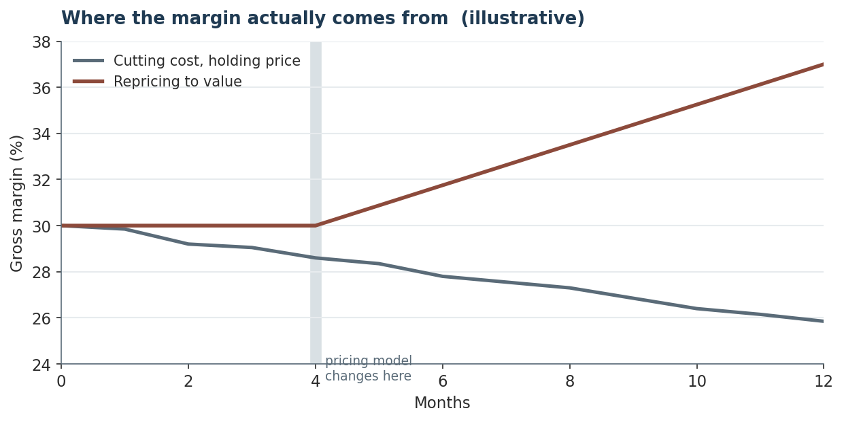
Figure 2. Cutting cost holds the line. Repricing to value moves it. Illustrative.
Read a gross margin line and the first question is not “what can we cut.” It is “are we charging for the value we deliver.” Usually the answer is no.
The labor line is where operators earn their keep
In a services business, labor is the biggest number on the page and the least understood. It also gets misdiagnosed the most. “We have too many people” is rarely the real issue. “We have expensive people doing work that does not need them” almost always is.
The number that exposes this is utilization, the gap between the hours you pay for and the hours that produce something a customer values. In professional services the healthy band sits around 70 to 80 percent. Below that, you are buying capacity you never use. The fix is rarely a layoff. It is moving work to where it costs less, and freeing your expensive people to do the thing you actually hired them for.
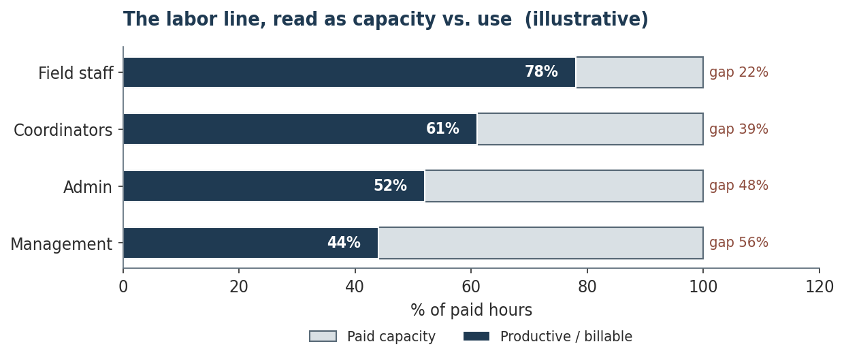
Figure 3. Paid capacity against productive hours, by role. The gap, not the headcount, is the story. Illustrative.
Pair that with a visible operating cadence, a weekly number every manager can see and is accountable for, and the labor line stops being a fixed cost you tolerate. It becomes something you steer.
Follow the trend line, not the total
A single-period P&L is a photograph. It tells you the business was standing there when the shutter clicked. It says nothing about which way anything is moving, and direction is the whole point.
So index the expense lines to revenue and watch them across eight quarters. A cost that grows in step with revenue is usually fine. A cost that grows faster is where next year’s margin problem is being born, quietly, while everyone stares at the total. Software and subscriptions is the classic offender. Nobody cancels anything, three tools do the job of one, and the line creeps up two points a quarter until it is a real number.
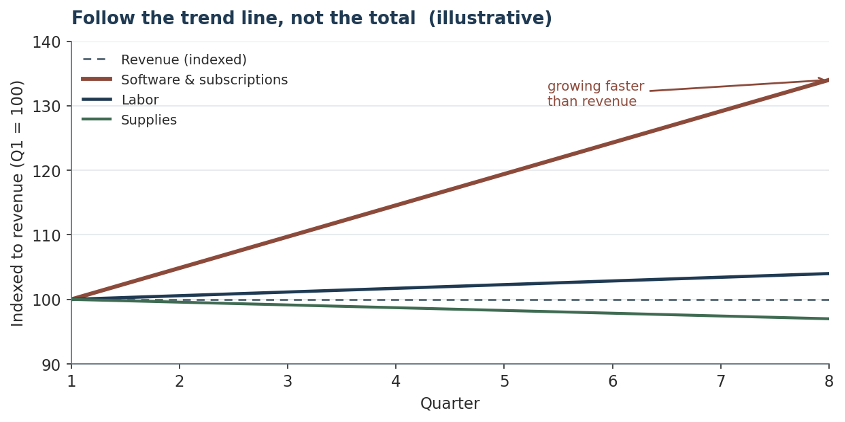
Figure 4. Expense lines indexed to revenue over time. One is diverging. That is the one to ask about. Illustrative.
This is the habit that separates diagnosis from reaction. Anyone can see a bad quarter. The operator sees the slope that produced it two years earlier.
What the P&L will not tell you
Here is the honest limit. The P&L is a lagging summary of decisions made months ago. It shows you the symptom, never the cause. The cause lives in the operation, and you have to go find it.
The customer who is 30 percent of revenue and knows it. The contract that renews at a discount nobody remembers agreeing to. The one process everybody quietly works around. The manager holding a whole function together with duct tape and goodwill, whose departure would show up on the P&L a full quarter after it mattered. None of that is on the page. The best the P&L can do is point you toward the right questions and send you out to ask them in person.
The operator’s habit
Reading a P&L like an operator is not really a finance skill. It is a way of deciding where to look. It works the same whether you are diagnosing a portfolio company in month one or running a business unit you have known for years.
The margin is rarely missing. It is usually just misfiled, sitting under a category that hides it, waiting for someone to reorganize the page and ask the obvious question. That someone is worth more to a business than the person who simply closes the books. Same document. Different job.
References
- Alvarez & Marsal, Private Equity Firms Turn to Operational Value Creation (2026) — margin improvement now 51% of EBITDA growth. https://www.alvarezandmarsal.com/press-release/private-equity-firms-turn-to-operational-value-creation-as-geopolitical-shocks-derail-deal-recovery
- E78 Partners, Private Equity Value Creation in 2025: Five Key Levers. https://e78partners.com/blog/private-equity-in-2025-five-key-levers-driving-value-creation/
- Accenture, Innovating in Private Equity Operational Value Creation. https://www.accenture.com/us-en/insights/strategy/operational-value-creation
- Vistaar, Value-Based Pricing (2026) — includes the McKinsey 1% price / operating profit figure. https://www.vistaar.com/blog/value-based-pricing
- Reasonable Product, From Cost-Plus to Value-Based Pricing. https://reasonableproduct.com/articles/from-cost-plus-to-value-based-rethinking-how-you-set-prices/
- Asana, Utilization Rate: Formula, Benchmarks & How to Improve (2026). https://asana.com/resources/utilization-rate
- NetSuite, What Is Utilization Rate and How Do I Calculate It. https://www.netsuite.com/portal/resource/articles/accounting/utilization-rates.shtml